Dataprint
Dataprint centralizes the entire proposal workflow — from RFQ analysis to asset management to final document assembly — replacing the fragmented, manual processes that cost proposal teams weeks per submission.
Discovery
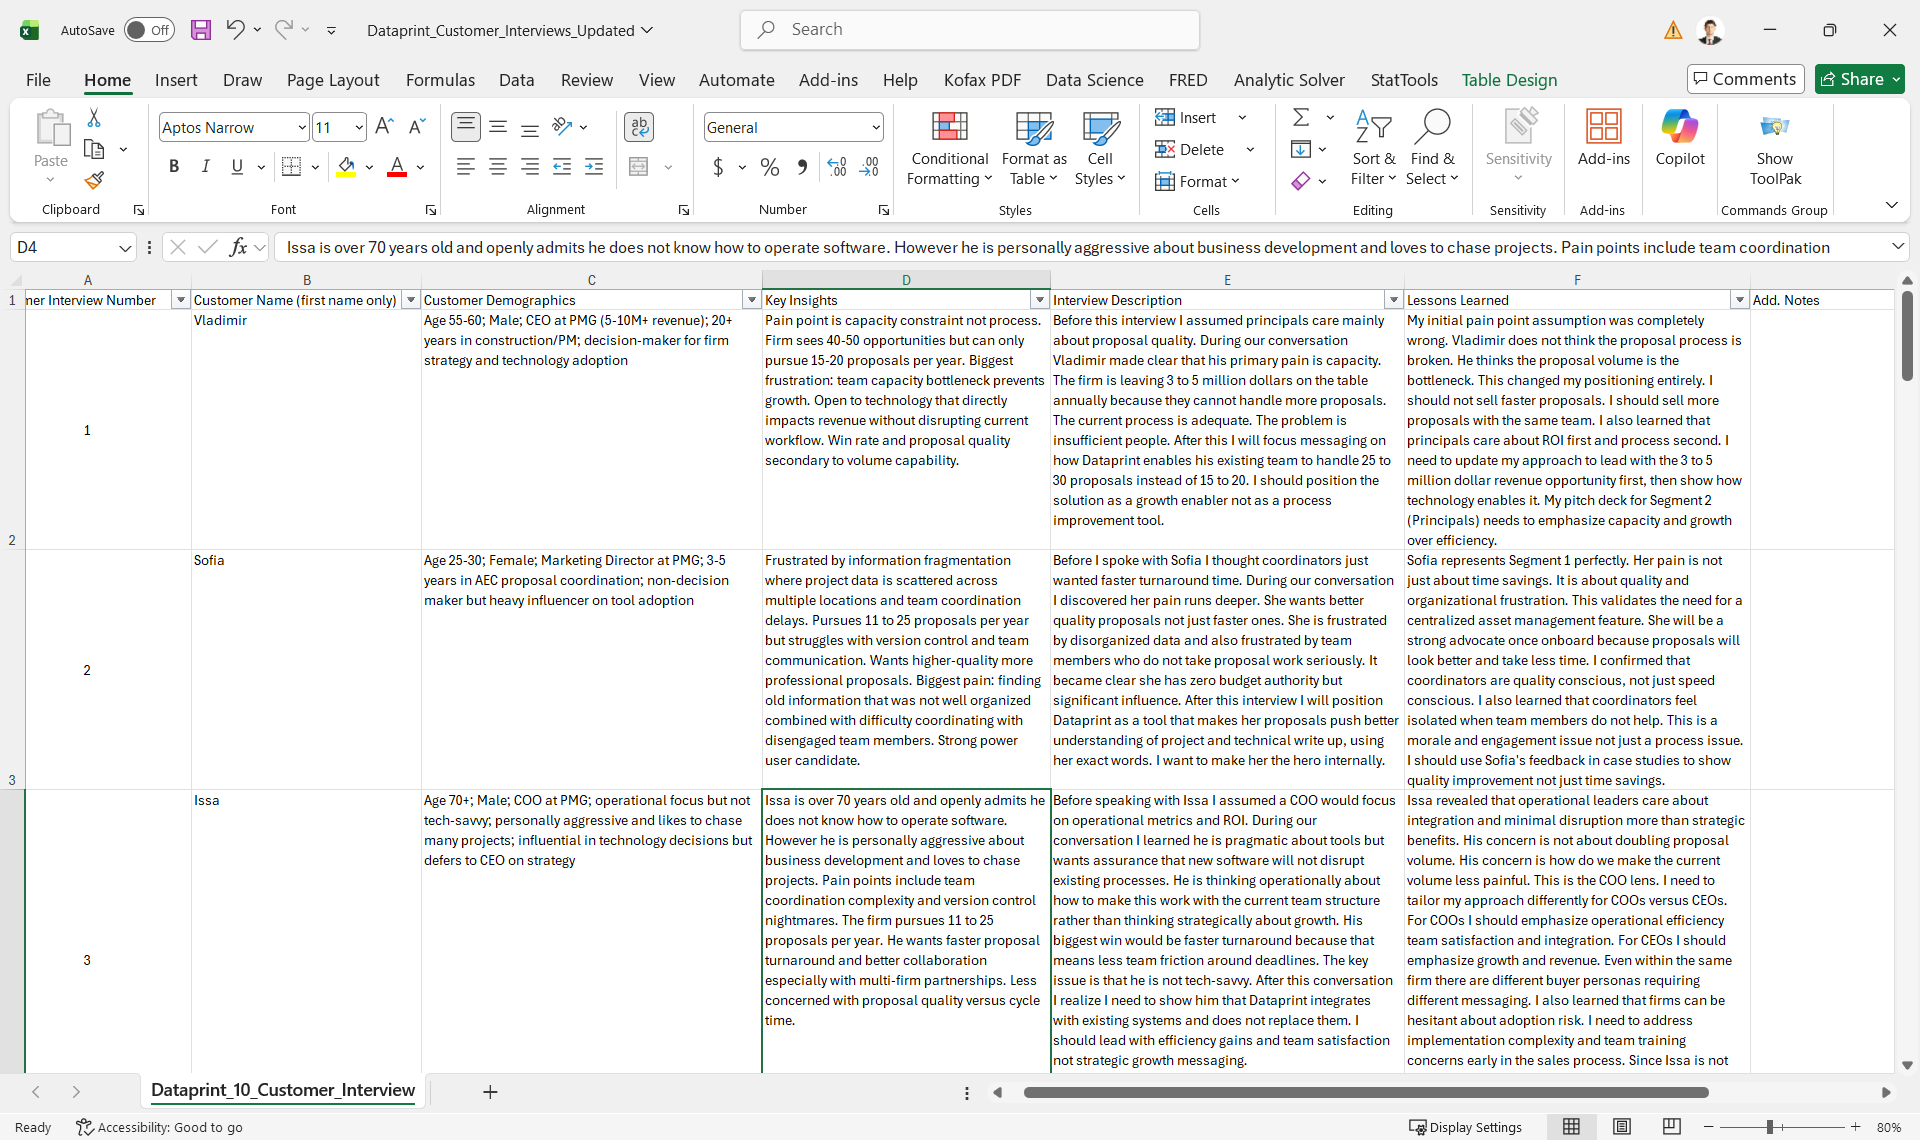
Interviewed proposal writers and marketing managers across AEC firms and found that formal proposals were taking weeks to assemble due to manual input, asset hunting, editing, and tailoring. Analyzed competitors and identified a critical market gap: existing tools served enterprise firms at $30K+ per year, leaving small to mid-size businesses completely unserved.
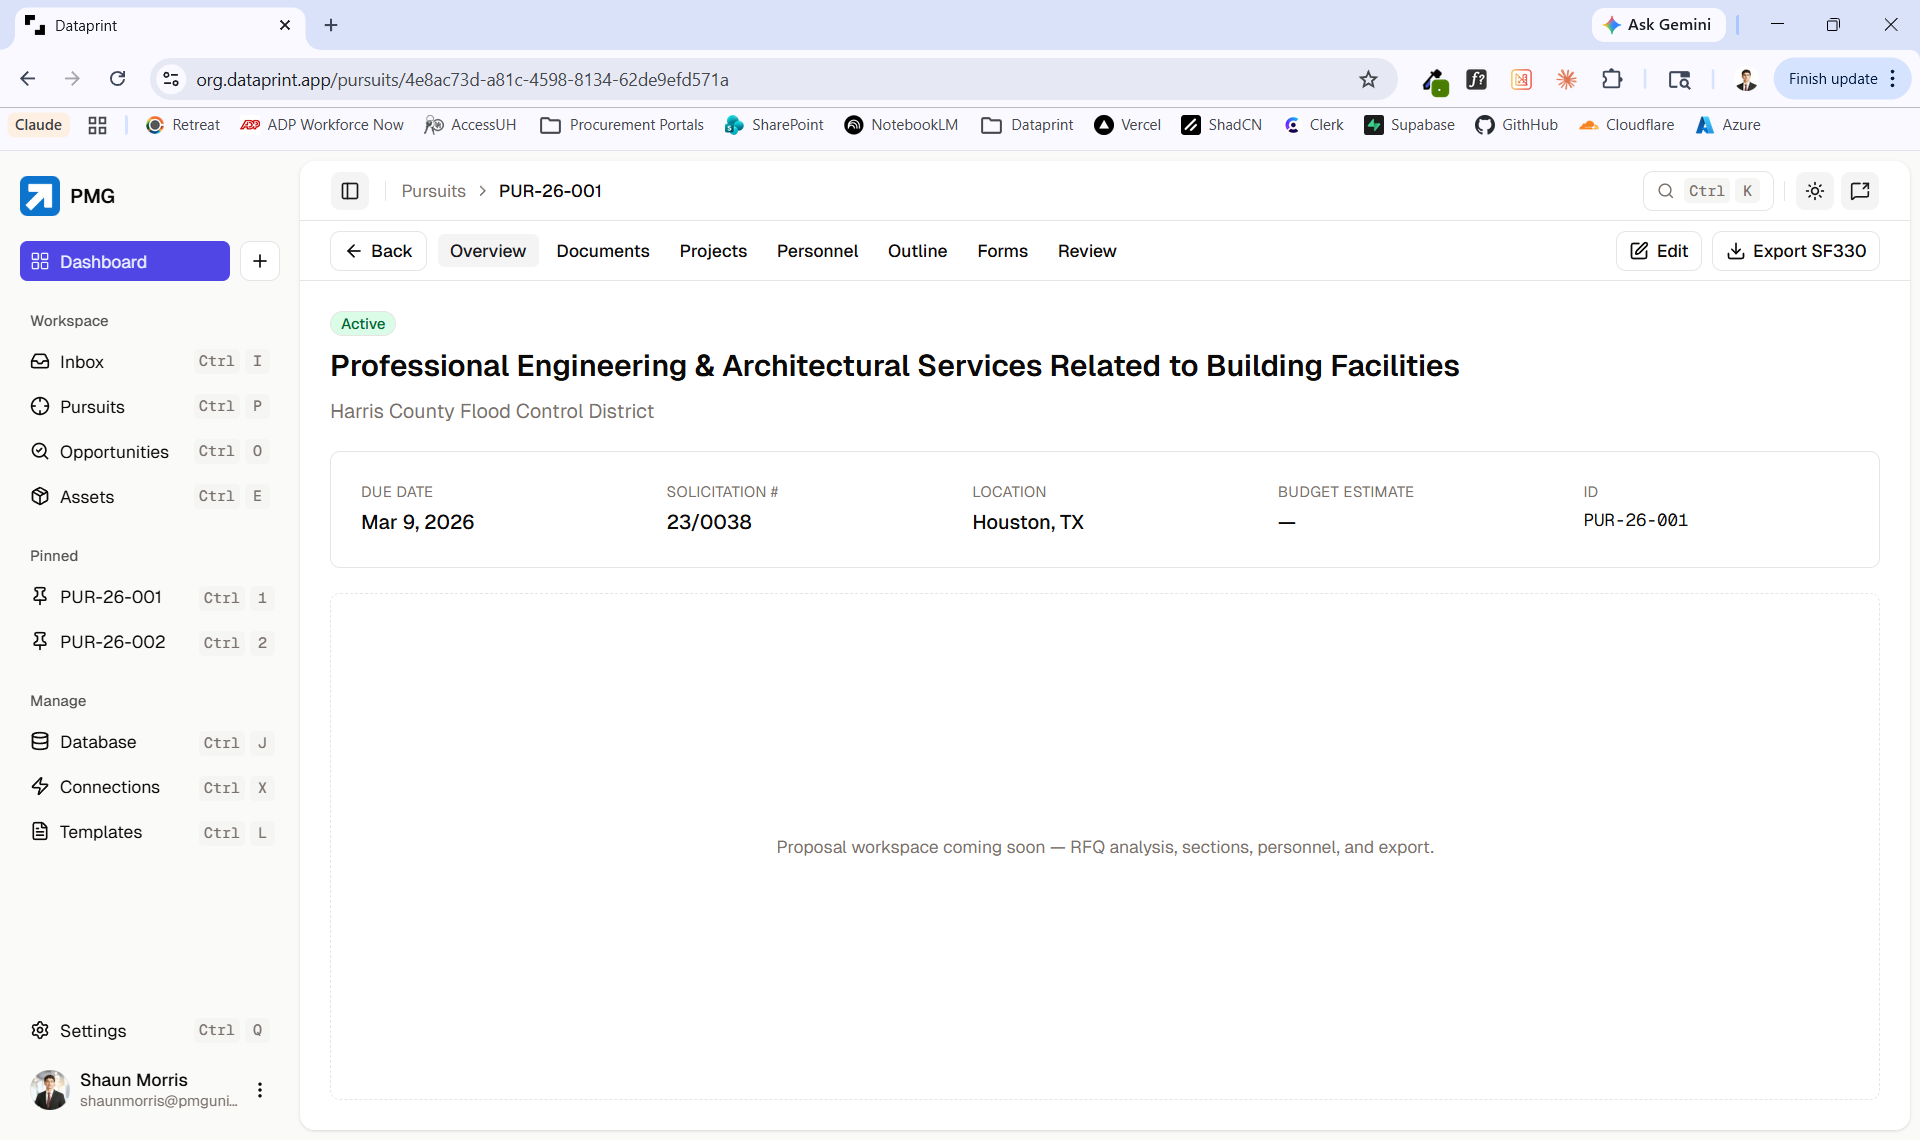
Wireframe
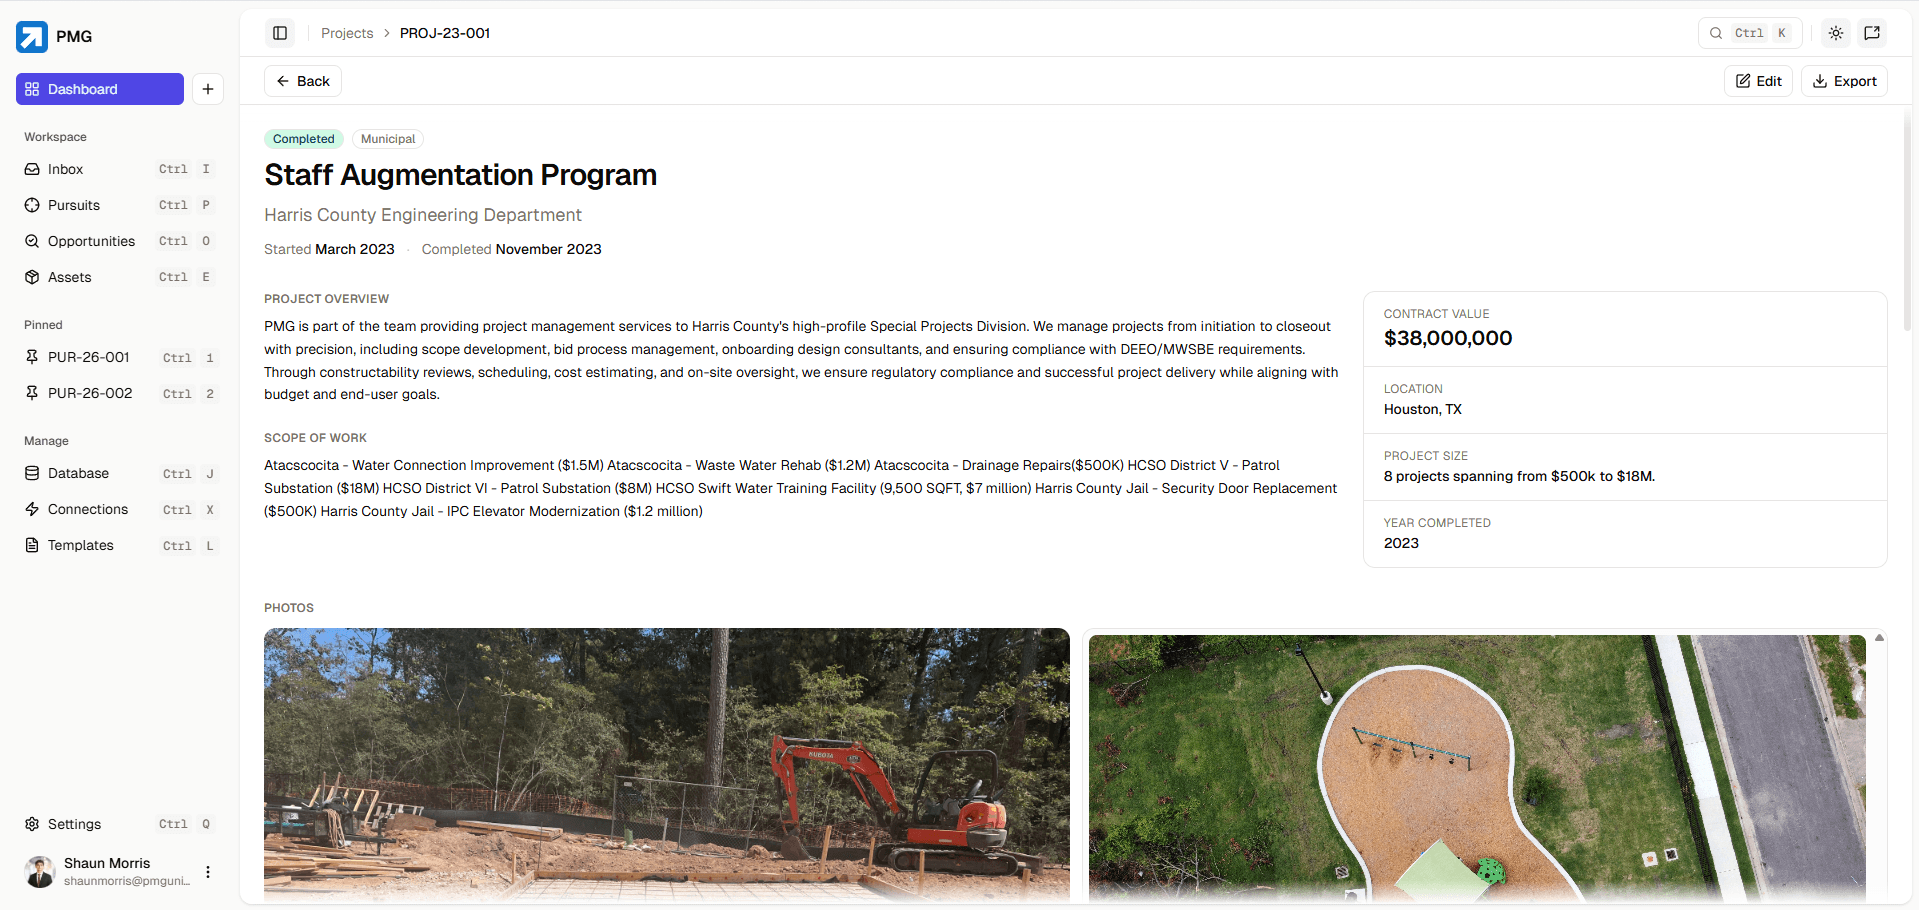
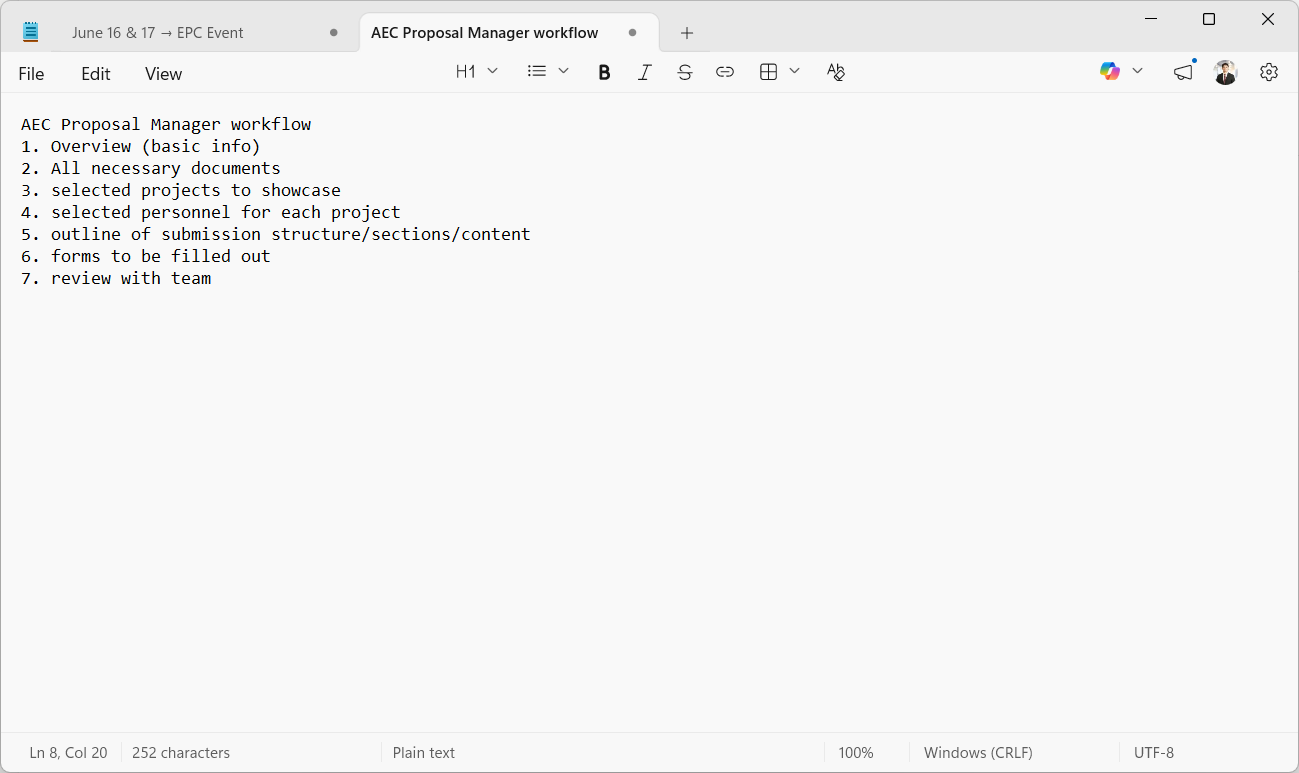
Mapped the full proposal manager workflow from RFQ intake to final handoff and designed the platform to mirror and enhance that existing process. The core flow moves through RFQ analysis, service and project selection, personnel matching, and document assembly — all within a single pursuit section so users never leave context to hunt for assets.
Prototype
Started with a responsive resume builder as the initial MVP, then iterated toward the full proposal ecosystem after recognizing that a single tool still left users stitching workflows together elsewhere. Solved the Adobe InDesign integration challenge by developing a separate native plugin, since InDesign is where most proposal teams finalize their documents.
Ship
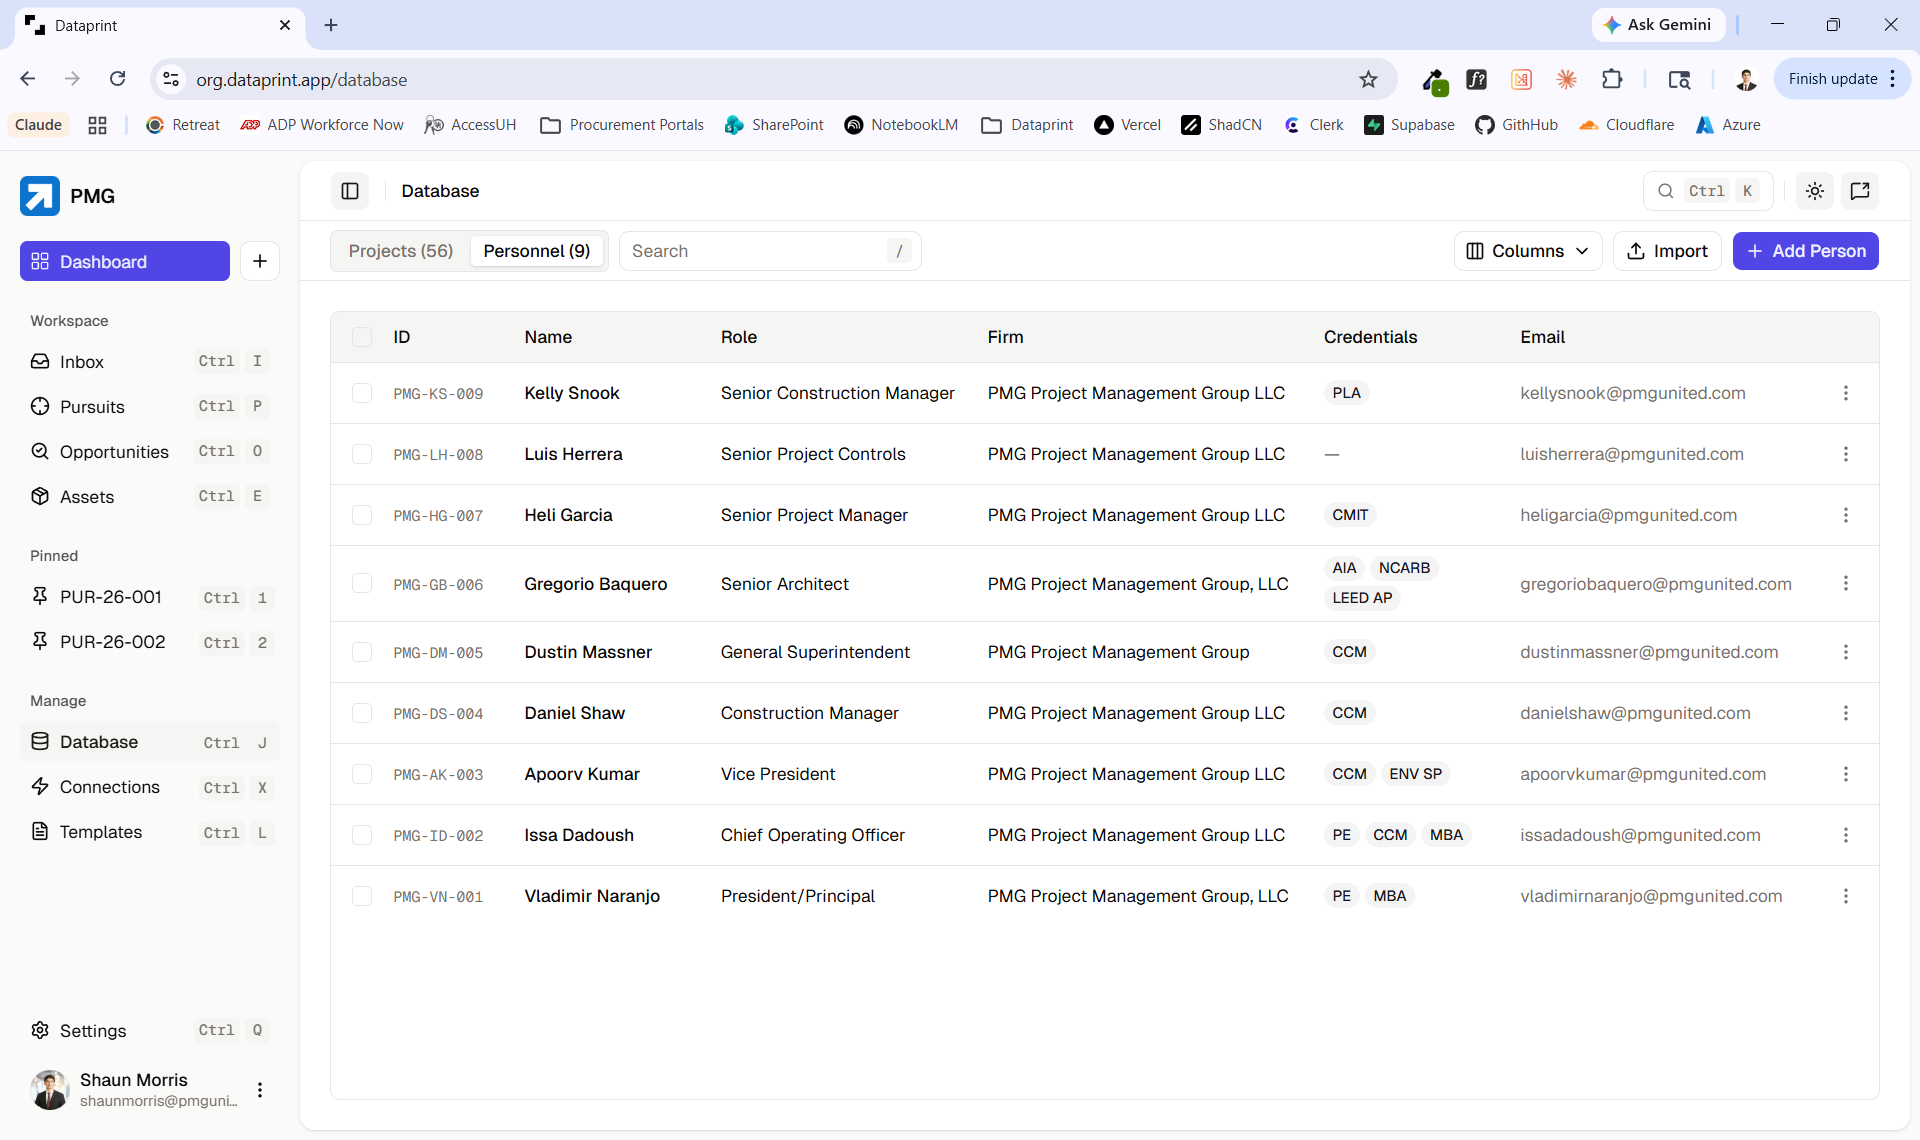
Currently in active development nearing completion for 2026 commercial launch targeting small to mid-market AEC firms across the US. Key features include an AI-powered RFQ analyzer, PDF and Word document export for assets, and semantic search for projects and personnel that surfaces the right content based on meaning rather than keywords.